Showing posts sorted by relevance for query shadow inventory. Sort by date Show all posts

Wednesday, July 18, 2012

The Housing Market Black Hole

We have reached a profound point in economic history where the truth is unpalatable to the political class  -  and that truth is that the scale and magnitude of the problem is larger than their ability to respond - and it terrifies them...Bad things are going to happen.  - Hugh Hendry on CNBC
Once again we're going through another wash, rinse, repeat cycle with the housing market fairy tales.  People who bother to pay attention to the news woke up this morning to a report from the Commerce Dept that housing starts rose the highest level since 2008 in June LINK.  I'm not sure why that would be considered good news, since 2008 is when the bottom really fell out of the housing market.  The other anomaly that contradicts this Government-compiled data is that mortgage purchase applications continue to decline on a weekly basis.  Note:  the mortgage application data is compiled and released by a private, free enterprise organization so we can safely assume that the data report is infinitely more reliable than that of the Government's Commerce Department.

The other myth being propagated by the media and the economic wizards is that the housing inventory is declining.  In fact, this housing inventory has largely been converted to rentals.  In particular Fannie Mae and Freddie Mac have been unloading their foreclosed inventory into institutional investors using Taxpayer money to subsidize the transactions.  Interestingly and anecdotally, I was perusing the home rental listings in the Denver area for a friend who may be moving to Denver and I noticed that rents had decreased by about 10% from just 6 months ago, when I was looking for a new rental.  If in fact the total housing inventory, for sale + rentals, was declining then we would expect that rents would be stable or increasing.

So where's the black hole disconnect?  For one, the data is highly suspect, especially since mortgage purchase applications do not correlated with sales and starts.  To be sure, I'm sure home builders are taking advantage of near-zero interest rates and borrowing as much as they can to build.  But, as zerohedge crunched this morning's housing starts numbers, the number of homes actually completed is well below the run-rate of starts:  LINK.  A form of "channel stuffing" for home builders is to start a lot of homes but take a long time to complete them, since the stock market and investors only care about the headline "starts" data.

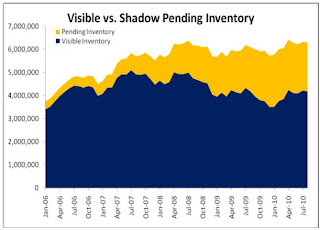
Even uglier, the "shadow" inventory of housing market is going to start rising rapidly this year.  The "shadow" inventory primarily is composed of homes in which the homeowner is in some form of delinquency or technical default.  These are homes where the lender/bank has opted to sit on the non-paying mortgage rather take on the ownership responsibilities of foreclosing, primarily real estate tax and HOA dues expenses.  If banks thought they could foreclose and sell quickly without incurring a big capital hit, they would.  But instead they let the homeowner live "rent free" but still on the hook for taxes and HOA dues.  This is especially true in the jumbo-mortgage segment (anything over $417k).  In fact, I know of several people who are sitting in high 6-digit and low 7-digit value homes who have not made mortgage payments for at least a year.

These delinquent/default mortgage homes are just part of the shadow inventory.  The other primary part is actual foreclosures.  We had a moratorium in foreclosures while the mortgage fraud litigation was being settled, of course on favorable terms for the banks.  FNM/FRE also delayed their foreclosure process while they unloaded substantial REO on the market.   So what is the data showing us?  From Bloomberg:
The shadow inventory of homes – those in foreclosure plus those 90 days late on mortgage payments – is on the rise again, a further indication that the supply side has not yet healed. According to RealtyTrac, foreclosure starts jumped 6 percent on a year ago basis in the second quarter, the first year-over-year increase since 2009. There are roughly 4.16 million homes that could begin to flow to market.
What's even more troubling is that the Government's FHA filled in the lending void created by the massive financial troubles at FNM/FRE.  In fact, over the past few years, the Government subsidization of the housing market shifted from FNM/FRE to the use of the FHA.  The FHA became the predominant source for mortgages and rolled out several no-down-payment/3.5% down payment programs.  And now, predictably FHA delinquencies are rising quickly, up a frightening 26% from last year:  LINK.   Why is this "frightening?"  One, because it means that the FHA will be forced to foreclose on a huge number of homes, further contributing to the housing market inventory;  and two, because the FHA is going to require a massive taxpayer bailout.

How can the housing market possibly be "stabilizing" and inventories be "returning to a healthy level" given all of this evidence to the contrary?   The housing market is one giant black hole of wasted resources and fraudulent representation of the numbers.  What's worse is that via the FHA, the Government has been using taxpayer money to subsidize a significant portion of the mortgages that have been used to purchase homes since 2008.  And now it's the FHA's turn to blow up.

It will be impossible for the housing market to ever bottom and stabilize until this country recovers economically.  This means real jobs are created which create real income growth and real employment growth.  Furthermore, the totality of the existing REAL inventory has to clear the market.  This requires demographic growth that our system can not possibly support until all the problems we know about are solved and put behind us.  THAT, my friends, will never happen in my lifetime or your's.

Tuesday, August 4, 2009

Don't Believe The Housing Hype

In an earlier post I showed, with plenty of back-up data, that in the next 6-12 months the housing market will be flooded with homes from prime mortgage foreclosures. I showed,using conservative calculations, that the value of that foreclosed inventory can easily reach or exceed the entire size of the $500 billion subprime market.

I didn't mention the "shadow" inventory of homes that currently hangs over the market. The shadow inventory would be the homeowners who are thinking about selling but want to wait until the market "firms" up. Well, today Reuters posted an article titled "'Shadow' Inventory Lurks Over U.S. Housing Recovery." Here's an interesting quote from the article from zillow.com, an online real estate service site:

"The number of homes listed officially on the market, while still at historically high levels, might be only the tip of the iceberg," said Stan Humphries, chief economist at real estate website Zillow.com in Seattle, Washington. (emphasis mine).

A survey of 2,123 adults conducted by Zillow found that the potential number of "shadow" sellers could be as highs as 20 million.

Here's a link to the article:

http://www.reuters.com/article/GCA-Housing/idUSTRE56U5YZ20090731

When you combine the "shadow" inventory with coming tsunami of foreclosure inventory, it is clear that the housing crisis in this country is not even halfway to its bottom. It is my view that housing prices still have another 30-40% of downside before any kind of real bottom is reached.

Wednesday, June 22, 2011

Housing Gets Even Worse And Gold Looks Even Better

To begin with, I wanted quickly to recount a conversation I heard this morning on CNN with South Carolina Senator, Jim DeMint.  DeMint has some type of "pledge" in which he wants all Congressional signees (presumably only Republicans might sign) to withhold their backing of the debt limit increase unless legislation is also passed which implements programs which would presumably lead to an eventual balanced budget.

This is pure theater of the absurd.  We wouldn't even be in this mess if our system was based on a gold standard.  DeMint's pledge paper is worthless and Washington DC will ultimately spend this country into collapse.  Period.  Here's a brilliant quote for Richard Russell: 
A few things you know for certain.  Gold will not go bankrupt.  Gold will always have a market.  All fiat money becomes worthless over time.  Gold is real tangible money, and it will be around when the last issue of fiat money is struggling to survive.  Gold has a five thousand year history of representing wealth.  No fiat money has ever lasted as long as a hundred years.
Taking from the real life example going on in Greece right now, this shows why gold is not even remotely in a bubble and it demonstrates the true flight-to-safety/wealth preservation nature of this precious metal (and silver):  Greek citizens are emptying savings accounts and buying gold as they brace themselves for the possibility of a sovereign default and a run on the banks.  The entire article is worth reading, here's the LINK  (when you pull it up, if it asks you to register in order to read the article, copy the headline and type it into the google search bar and click on the article link after you search and you should be able to see the entire article).

Housing continues to crash, despite the best "spin" the media attempts to paint over the facts.  Recall that one of my premises is that the "shadow" inventory of homes is significantly larger than is widely acknowledged by anyone in the media, Wall Street and even most analyst/commentators. We know that banks are substantially slowing down foreclosures and default declarations and doing what they can to avoid taking on more REO.  It is my contention that the REO component of the shadow inventory is massively larger than is being published by the Government or private sources (the other primary "shadow inventory" component would be all those people current on their mortgage but would sell their house if they could get a price equal to their outstanding mortgage and all those who want to sell before the next leg down but are waiting for the market to "come back a little").

Well, the FT Blog published an article which attempts to quantify the growing REO (real estate owned) inventory at FNM/FRE/GNMA/FHA:
The federal share of REO property is also rising. For 1Q, RealtyTrac estimates that total REO property held by lenders totaled 872,000. Of this, we know from monthly or quarterly financial statements that Fannie Mae, Freddie Mac, and the FHA hold roughly 300,000 of these properties on their books, and that this inventory has been rising by more than total REO inventories over the last year. Over the next few quarters, the federally backed entities are likely to see their inventories of REO property become a larger share of the total
Here's the LINK  If you read the article, you'll see that it is likely that if the Government does not play "hide the salami" with its housing inventory the way banks do, the amount of homes streaming into the "for sale" inventory could increase by as much as 30%.   You still feel confident that we've reached the bottom of the housing crash?

Before you answer that question, take a look at this existing home sales data released yesterday, as existing home sales hit a six-month low:  LINK  Hmmmm, I thought we were in the peak selling season for housing...

Wednesday, January 19, 2011

More Doom For The Housing Market

Note: My vision may be doomy and gloomy, but it is not seeded in pessimism and negativity - rather it is a product of realism and a desire to understand the truth.  The truth is our only hope for salvation.  After all, the truth is the agent of purification...

I find it amusing that everyone with whom I discuss the housing market seems to understand how bad the market is everywhere except in their own area.  I was chatting with someone a couple days ago about Denver area real estate who is expecting a bounce in the Denver market and remarked that Denver seemed to be in better shape than most big cities.  I agreed that Denver's economy is strong on a relative basis but then I pointed out to her that I saw a list published last week of the top-10 cities for the rate of foreclosures and Denver was 10th on that list.  Hmmm...and the foreclosure situation will get a LOT worse this year:  OOPS

That metric leads nicely into this blog post I came across this morning which describes one of the fundamental problems with the housing market - and one to which I have pointed for a couple years:   almost everyone who wanted to, or could, buy a house has already bought a house over the last 10 years and the pool of available homebuyers is drying up.  And to make matters worse, many of those buyers are now in some stage of mortgage default.  With foreclosures piling up and home-ownership rates declining, the pool of actual buyers is rapidly declining, especially relative to real inventory (real inventory = Govt/industry-reported inventory PLUS shadow inventory, where "shadow inventory" is defined as those who want to sell plus all the homes in default/foreclosure but not included in bank REO).  This blog post discusses the declining pool of homebuyers, LINK.  A post of mine earlier this month (or maybe late last month) better quantifies the shadow inventory metrics.

The mortgage bankers association's weekly mortgage application index was released today and showed further deterioration in the purchase index.  Clearly, with interest rates beginning to trend higher and the housing market in a seasonally "soft" period in terms of demand (I'm seeing "price reduced" signs on top of "for sale" signs all over Denver), you would think that anyone thinking about buying a home would want to lock in the current mortgage rates - and take advantage of "price reduced" deals - and that on a seasonally-adjusted basis, the purchase index would at worst be flat.  Historically, the behavioral statistics for the housing market show that buying activity spikes when interest rates start to rise.  We are not seeing this in the numbers this time.

Which leads me to my final point.  By now everyone knows that the latest numbers show that China (and Russia) unloaded some of their Treasury bond holdings in November (the data has a 2 month lag).  This is not good news for interest rates in this country if that becomes a trend, even if the Fed continues to fill in for the declining demand for - and  rapidly expanding supply of - Treasuries in order to make sure Treasury auctions get funded.  And there's no doubt in my mind that the Fed will do this.  Even after the Fed announced QE2, bond prices at the longer end of the curve (10-30 years) started to drop and interest rates rose.  Expect this trend to continue and expect mortgage finance rates to climb and expect even greater weakness in the housing market this year than is expected by most.

Thursday, February 23, 2012

Feast or Famine

It's famine time for most people in this country, but the bankers and financiers who feasted on fraud during the last decade are now feasting on the avalanche of corruption that has hit our system at the highest levels of Government (see MF Global and Solyndra, for example). 

I wanted to do a quick follow-up on yesterday's post with some more data.  First, based on NAR data - which we know is typically bloated with overstatement - the median home price in this country has hit a new 10-year low (median = half of all sales are above that level and half are below)  LINK  I have a feeling that the data is skewed by some of the very high end sales that have occurred in NYC and I would bet that the mean, or average, sales price is lower than the median since there has been a preponderance of distressed sales at levels which occur well below the median but are "poo poo'd" by the industry as "distressed one-time events" lol.

It's mainly been the low-end that has "pulled down" market values since the financial crisis hit in 2008.  But now, for several reasons, I believe that there will be a literal flood of mid to high-end foreclosure properties that will hit the market over the next 12-24 months which will literally crush home values to even lower levels.

To begin with, banks and Fannie Mae/Freddie Mac primarily foreclosed on the large base of lower end homes over the past 4 years, as it was easier to move the REO inventory into distressed buyer hands because typically financing is not required and those homes are more easily "flipped" or rented.    Moreover, we've seen big banks like Bank of America unload large blocs of distressed property onto the balance sheets of FNM/FRE.  And we know FNM/FRE are overloaded with REO inventory because now the Fed and Obama Admin are in the process of converting a large portion of that inventory into rental units.   That move in and of itself will place downward pressure on market values because the new flood of rental space will once again skew the economics of renting vs. buying toward renting, thereby forcing home prices lower - the 'ole "income and substitution" effect we learned in Intro to Economics.

But there's another phenomenon that's witheld a lot of high end foreclosures from happening.  Banks have been allowing people who have technically defaulted on jumbo mortgages to remain in their homes without making any mortgage payments for anywhere from 1 to 3 years.  There's a mathematical reason for this.  Most jumbo mortgage paper still sits in one form or another (outright mortgages or in the form of "put backs" written into securitization documents) on bank balance sheets (off-balance sheet when in the form of a "put-back," which requires the bank to back mortgages on properties below a specified loan-to-value ratio or are non-performing).  If a bank forecloses on a $250k home with a $200k mortgage that it can unload for $200k, the bank eats only $50k.  But if a bank has to foreclose on a $2 million mortgage on a home worth maybe $1.2 million (these are real life data points), the bank eats $800k.   That write-down is a direct hit to the banks tier 1 capital ratio, which is the equivalent of cyanide to a bank.  Moreover, it's significantly more difficult for a bank to move a high 6-figure or 7-figure home.   And the number of people who can actually afford to buy a home like that is shrinking.  It's this dynamic that has created a massive "shadow inventory" of high-end homes (remember the McMansion craze?) that do not show up in the inventory numbers yet:
A huge "shadow inventory" is building of elite homes that are in default but have not been put on the market...The backlog reflects the pent-up flood of foreclosed properties of all price ranges that are expected to hit the U.S. market this year, especially after five major banks reached a $25 billion settlement last week with the U.S. over fraudulent foreclosure practices  LINK
I'm sure everyone reading this knows at least one person living in what was originally a 7-figure home and who hasn't made mortgage payments for at least a year and hasn't been contacted by the bank about foreclosure or short-sale requirements.  But this is changing, as there is now pressure on the banks to start monetizing the big base of hopelessly delinquent jumbo mortgages.  Even though banks are reporting impressive GAAP/phony earnings, they are being squeezed for actual cash flow by low interest rates and lack of lending opportunities that make economic sense and terminally delinquent jumbo mortgages are a huge cash drain to the big banks.

What really irritates me about that this whole thing is when I have to listen financial advisers, idiots on CNBC and other various "experts" proclaim at every step-down in housing values that we've hit a bottom.  We've had zero interest rates in this country for quite some time and we keep hitting new record lows in mortgage rates.  And yet, the housing market continues to plummet further into the abyss.  The only purpose served by the intervention of the Fed and the Government in the housing market has been to keep banks from choking to death on bad mortgages and, even worse, to prevent the market from freely reaching a price point which will clear the massive imbalance between true supply and real demand.  By the time we see the housing market finally "clear," - and I don't expect it to happen in my lifetime - the language of choice in our school system will be Mandarin.

Friday, August 21, 2009

The Existing Home Sales "Bounce" Will Be Brief

The existing home sales number released today showed a slightly better than expected number for the month of July. Given that we are in the heart of home buying season, given all of the money pumped into the system by the Fed AND especially given the $8,000 first time home buyer tax credit, we shouldn't be surprised to see a small, seasonal bounce in home sales right now.

As pointed out by Clusterstock.com: Existing Home Sales would have been negative over June if not for the increase in Northeast Condo sales, Single Family Detached sales were DOWN 5000 units June to July, and in the all-important Western region, existing sales were down 10%.

But let's look at the underlying factors and data to understand what is really going on with the "seasonally adjusted" and polished-up-for-public-presentation number released by the National Association of Realtors. Here are the factors we see that will undermine this brief respite from the ongoing housing Depression:

1) The universe of qualified first-time home buyers gets exhausted; 2) Distressed investors step away as the ever-present "shadow" inventory becomes actual inventory (shadow inventory is bank-owned homes and would-be sellers waiting for "a bounce in the market"); and 3) The massive wave of prime mortgage foreclosures will flood the market, putting pressure on prices in every price-segment AND on buyer demand.

First-time home buyers and foreclosure/short-sale buyers - so-called distressed investors - represented 61% of the estimated sales for July. This metric is not a sign of a healthy, sustainable market for a couple reasons. First-time buyers are most likely "pulling" future sales into the present, as the first-time home buyer tax credit of $8,000 is set to expire in December. Home sales drop off anyway after August, so we would expect to see an even bigger drop in the third and fourth quarters, even if Obama extends taxpayer subsidization of first-time buyers.

As for the distressed investor segment, many of these buyers will look to "flip" their "distressed" purchase fairly quickly or they'll be forced to rent out the property to avoid the negative cash flow hit from holding investment homes. But renting will be made a lot more difficult by the record inventory of rentals units currently on the market, and growing. I would expect to see a lot of "investors" look to try and unload their property if they can't rent it out or become nervous about the market.

And finally, the inventory levels are still at unusually high levels. We know for a fact that banks have been withholding foreclosed homes on their books (REO, real estate owned) from the market in an attempt to reduce supply and hold up prices. We also know, as reported yesterday, that the percentage of properties in foreclosure or delinquency hit a record high of 13.2% of all single-family mortgages. What makes this metric even more severe in terms of housing market economics is the large jump in foreclosures in prime mortgages and FHA-insured mortgages.

Up to this point, the lower priced homes, typically bought by first-timers and distressed investors, have been by far the highest component of existing homes sales. With the impending tsunami of prime mortgage foreclosures will be a flood of much higher priced homes, which will ultimately put a lot of pressure on the lower end of the market. Of course eventually these banks will have to put a lot of their foreclosure inventory on the market, which will exacerbate the problem.

Ultimately this brief "bounce" in home sales will run into the problems discussed above and, because the Fed and the Government tried to put a floor under the market, the ensuing next leg down will be even worse than what we went through over the past 18 months. It will be interesting to see if the Government decides to spend some of the trillions of dollars it's printing to become a home buyer of last resort (I say this only half-facetiously because I bet it's been discussed). Let's not forget that the taxpayer now owns outright or de facto General Motors, Fannie Mae, Freddie Mac, Citibank and AIG. So in a way, via FNM and FRE, the taxpayer is already monetizing the housing market.

Monday, August 13, 2012

Housing: Look Out Below

The July employment and unemployment numbers published today, August 3rd, were worthless and likely misleading.  What has been done in the last couple of decades to the reporting methodologies for monthly labor data, compounded by distortions introduced into the system from the economic collapse of the last five years, has left the heavily-followed employment and unemployment series seriously impaired as to significance, and potentially subject to direct political manipulation  - John Williams, Shadow Statistics
I thought I would briefly summarize where I think we stand with the housing market.  This will be conceptual, but conceptual based on links and data I have presented on this blog, and specifically data and trends so far this year.  If I make any claims that need empirical back-up in your mind, please search the archives for 2012.

An ongoing debate in the media this year has been over whether or not the housing market has bottomed and is poised to move higher.  This "debate" is largely skewed to toward the "bottom is in, blue skies ahead" camp, as that is the overwhelming editorial bias of the U.S. media at large. Unfortunately, the mass perception of anything economic is formed by looking at headlines and hearing sound bytes.  And the sound bytes have been bullishly optimistic.

The truth is that, yes, there has been a slight bounce in home sales this year and slight bounce in prices.  Please accept that this is nothing more than a proverbial "dead cat" bounce.  After all, markets never go straight down to their eventual bottom - there's always a counter-trend "bounce" before the next leg down reasserts its ugly head.  Housing is no different, especially when you factor in the trillions of dollars printed up and borrowed in order to keep the banks from collapsing and giving them room to "reload" on housing debt - albeit under much more stringent credit guard rails than the first time around.

In addition, record low mortgage finance rates, plunging home prices and a shortage in apartment inventory has fueled an investor binge on "investment rental" properties, which has created an illusion of "organic" home sales.  Furthermore, the Government, using your tax money, has been subsidizing the cost of mortgages for those who refi, subsidizing the mortgage principal reduction programs designed to keep people in their homes and subsidizing the transfer of a massive amount of foreclosed homes from FNM/FRE to rental investors.  This dynamic, combined with the massive foreclosure moratorium for most of 2011, has created the dangerous illusion of growth in home sales and low inventory. 

Meanwhile, we have seen a big bounce in housing starts over the past year, fueled primarily by an usually large number of starts in multi-family units.  This of course is the market adjusting to the shortage in apartment inventory.  Over the next six months, this "shortage" will swing back to oversupply, as new apartment inventory competes with a large inventory of rental homes on the market.  Interestingly, in driving around downtown Denver this past weekend, plus perusing the rental listings in craigslist, I have noticed that apartment rental prices has already started to soften up again.

Lower apartment rent will once again start another "negative feedback" cycle which will take house rental rates lower and ultimately force home prices lower.  Oh ya, one more point on housing prices.  Because of the nature of statistical measurement error, the claim that housing prices are actually rising is quite questionable.  The various surveys have shown slight month-to-month increases during 2012.  But, as anyone who has taken Statistics 101 knows (and being a U of Chicago grad, I had to suffer through some rigorous statistics courses), it is more accurate to characterize small changes over short periods of time as being attributable to data sample "noise" - measurement errors and the general nature of random sampling not necessarily being "random." 

Therefore, what has been characterized as "rising prices" by the media, Wall Street and the Government is more likely to be some sideways bouncing along a tenuous level of support which was put in place with a couple trillion dollars in Fed/Government stimulus programs.

So what next?  We are already seeing a significant acceleration in the number of foreclosures this year.  I have posted a couple links recently which show this.  Fannie and Freddie specifically unloaded inventory in order to make room for another big round of foreclosures.  Big banks sitting on a massive number of McMansions in default are now being forced to start foreclosing.  I have seen this in several high-end neighborhoods in Denver and personally know a couple people who have been tossed out of their big homes.  In other words the "shadow" inventory of homes is starting to transition into real inventory.  Not coincidentally, I have noticed a lot "for sale" signs popping up this month.  Ironically, we are transitioning into a seasonally slower period for real estate sales.  It will be interesting to see what the affect on prices will be by the end of this year by what I believe is going to be a large increase in "for sale/for rent" inventory.

Finally, to tie in the quote at the top from John Williams on unemployment, it is completely useless to even think about discussing a bottom for the housing market until this country figures out a way to fix the unemployment and joblessness problem.  How can we possibly have true, organic demand for housing when the size of the labor force - the amount of people who are actually working - continues to shrink?  Did I miss something magical about the demand for housing not being dependent on the number of people who can actually afford to buy a home?


Tuesday, March 22, 2011

Data Confirms My Outlook For The Housing Market

Nice to see Obama sipping champagne and enjoying himself in South America while he unConstitutionally puts American lives at risk in Libya and further imperils our future financially, eh?

But back to the mundane matter of the housing market.  As per the National Association of Realtors' report yesterday, existing home sales plunged 9.6% (annualized) in February and the number was substantially below the Wall Street-Einstein consensus estimate.  Prices declined 5.2% to their lowest level in nearly nine years.  That's a big price drop and, contrary to the views of the rather pedestrian mainstream analysts, lower prices are not stimulating sales.  Here is yesterday's report from Bloomberg news:  LINK

Today the Federal Housing Finance Authority reported a .3% price decline for January, BUT revised December's previously reported .3% to a 1% decline.  Here is that report:  LINK  Don't forget that is Government reported data, so the pig has probably been dressed up manipulatively with rose-colored lipstick.

Although real estate professionals and Wall Street will figure out a way to spin this data in a positive manner, the housing market still has a long to way to fall in order to correct from the massive bubble inflated by Greenspan and the related lending fraud enabled by the system.  While Govt/industry inventory shows relatively flat growth projections, the shadow inventory of foreclosures, impending foreclosures, unreported bank REO and potential existing homeowners who would like to sell but want to "wait for the market to come back a bit" has created a massive glut of inventory (and potential inventory) that it is going take substantially lower prices and a much stronger economy in order to restore supply/demand stability.  Of course, the Government and Wall Street would like you to believe that the shadow inventory is not really there, just like the Constitution...

I have been saying for quite some time that I expect to see prices decline to at least the average price levels from the early 1990's, before Greenspan's money printing mechanisms spawned successive asset bubbles and subsequent busts.

Here's two interesting graphs which show why I believe our economy is doomed - and therefore housing prices will continue to collapse - and why people are crazy to not move as much of their wealth as possible into gold and silver and out of dollar-based "assets," especially housing.  The first graph shows the Fed policy being implemented to try and prop up the economy/housing (you can enlarge the charts by clicking on them):


This graph reflects the liquidity being pumped into the system that supposedly is not leading to price inflation.  The next graph shows the ONLY result of this policy that the Government can't hide using manipulated data - the price level of the U.S. dollar index:


AND #1 and #2 causes #3 - the price of gold:


If the Fed does not continue #1, the economy collapses.  If #1 continues, #2 goes into cliff-dive.  If #1 and #2 continue to happen, gold and silver will move up to price levels that will shock and awe even well-seasoned gold-bugs.

People ask me all the time how high I think gold can go.  I refuse to put a price on it because most would think I'm nuts.  But let's just say that my price target is higher than that of  Jim Rickards or John Embry.  But if #1 and #2 continue the way I expect, I believe that my price views will prove correct....Gold, got any?

Monday, January 3, 2011

The Housing Market Could Get Annihilated In 2011...

Happy New Year everyone! Back in 2002 I made the prediction that housing values would eventually drop 70-80% from peak bubble valuations. Of course, back then I would have been horrified to know just how high prices were to get by 2007. At this point, in a lot of markets prices have dropped 10-20% on average so far, with 40-50% declines (or more at the high end) in the worst bubble States (Cali, FLA, Nevada, Arizona). The late and great Sir John Templeton, who was one of the pioneers of the modern mutual fund industry and a highly regarded investor, said in an interview sometime in 2002 that he would not touch U.S. real estate until it had fallen by 90% in value. I'm sticking with my call.

As to be expected, the mass financial media and most real estate market professionals (and of course a lot folks who have been well-trained by the Fed to "buy the dip" over the last 30 years) expect that the worst is over for the sector. Au contraire, mon frére (I guess I should say "al contrario, il mio amico - lol), there are several key forces at play, most of which go underreported, not reported, or are based on industry/Govt data which is highly manipulated.

Inventory - The biggest problem facing the housing market is the massive inventory sitting out there. Of course, the Nat'l Assoc. of Realtors reports the inventory of homes for sale to be around 3.7 million, or 9.5 month supply based on the existing rate of sales. Remember that rate of homes sales is still declining - existing home sales were down 28% for Nov '10 vs. '09 and new home sales were down 21% - so as we go forward, unless this rate picks up, the number of months it would take to clear the existing "for sale" inventory increases.

But there is a "shadow" inventory out there defined as pending REO (bank owned), pending foreclosed inventory and homes with mortgages in serious delinquency. Corelogic has defined this number to be around 2 million homes. Here's a great chart I borrowed from calculatedriskblog.com:

(click on chart to enlarge)

As you can see, if you include the homes that are likely to be foreclosed and assumed by the banks, a more realistic estimate of the housing inventor is close to 6 million.  And there are also a lot of people who are not in danger of defaulting on their mortgage, but who would sell if the market "bounces."  If you are skeptical of the forces of foreclosure, here's a news report from Reuters that came out last week describing the big jump in foreclosures during Q3:  LINK

So just based on the pure, good old fashioned law of supply/demand, there is going to have to be a major downward adjustment in the price of housing in order to clear this massive inventory overhanging the market.

Credit Markets - The biggest factor here is interest rates.  For several reasons, not the least of which is the rapidly expanding Government spending deficit and Treasury bond supply, interest rates will continue moving higher during 2011.  This factor alone, unless you have cash to buy a house, will make the current price level of housing unsustainable as the higher cost of a mortgage will reduce the overall amount someone can pay for a home by reducing the size of an affordable mortgage.  This is going to hammer the mid-priced housing segment. 

The other obvious factor here is the much tighter standards being enforced on mortgage lenders.  No more "liar" loans, pay-option ARMS and "sub-primers" qualifying for conventional GSE mortgages.  This factor not only eliminates a chunk of the population that had been buying homes during the bubble, but it too reduces that size of mortgage most people can assume. 

And finally, there is another tsunami of adjustable rate mortgage resets and refi's coming in 2011. Here's a chart to illustrate that is from Credit Suisse (edit in red is mine):

(click on chart to enlarge)

As you can see, the housing market price collapse that started in 2007 is highly correlated with the first wave of resets.  It took a few trillion of printed dollars from the Fed and the Treasury in order to stabilize the banking system and slow down the collapse in housing from this first wave.  Take a look at the size and composition of the second wave.  The beige bars are the nefarious pay-option ARMS, which were designed to let people opt not to pay most of their mortgage, with the unpaid portion added to outstanding mortgage balance.  It was this garbage that took down Countrywide, Washington Mutual and Wachovia.  The credit obligation from that abortion was largely transferred to the Treasury (i.e. the taxpayer).  Rest assured, the pay-option reset factor alone will make this next default wave even more nuclear than the last one.  (Also, I am skipping over all of the related collateral destruction the first time around, which includes the implosion of the big mortgage reinsurance companies, including AIG - who's garbage found a home with the U.S. Treasury).   This will devastate housing/real estate values.

There are several other factors which will further influence the declining value of housing and real estate.  The most prevalent being the general weak condition of the economy in the U.S.  And I am of the view that the economy will double dip this year (although massive QE/money printing may prevent this).   The reality is that the two major factors discussed above will be sufficient to cause what I believe will be a much larger than expected (by the media/Wall Street in general) decline in housing values during 2011.  I would not be surprised to see at least 10% in most markets.  While I have stopped putting a definitive timeframe on my economic/market predictions, I still believe that average prices in the housing market will get cut in half from here before this over.


Monday, April 26, 2010

Brace Yourself For Another Plunge in Housing

According to LPS - Lender Processing Services - the leading provider of data processing, servicing and default manangement services to the mortgage industry - there is a 9 year inventory of foreclosed homes sitting on bank balance sheets. This figure includes the number of homes likely to end up in foreclosure over the next couple of years and is based on a three-month average of foreclosed homes sold by banks:
As of March, banks had an inventory of about 1.1 million foreclosed homes, up 20% from a year earlier, according to estimates from LPS Applied Analytics. Another 4.8 million mortgage holders were at least 60 days behind on their payments or in the foreclosure process, meaning their homes were well on their way to the inventory pile. That “shadow inventory” was up 30% from a year earlier...Based on the rate at which banks have been selling those foreclosed homes over the past few months, all that inventory, real and shadow, would take 103 months to unload. (Here's the article link: LINK)
(click on chart to enlarge)

As home values continue to decline, high unemployment persists and more homeowners resort to strategic default (or "jingle mail"), the number of foreclosures will likely accelerate this year. In addion, Congress does not appear willing to extend the home buyer tax credit program when it expires in 4 days. To make matters worse, 58% of all modified mortgages re-default after just 8 months - a glaring failure of Obama's taxpayer-financed mortgage modification programs.

This in turn will lead to another massive heart attack in the banking system, which no doubt will again be paid for by taxpayers. The moral of this story is that if you are contemplating buying a home, your best move will be to hold off for at least another couple of years to see where this is going. I have said since 2003 that we could see a 75-85% decline in housing prices before a real bottom is hit. I still maintain that view and it would appear that the data may well validate my conviction.

Tuesday, March 23, 2010

Existing Home Sales Number Even More Bearish Than Headline Suggests...

The Nat'l Assoc. of Realtors reported it's existing home sales number for Feb. today and the numbers are much worse than the headline that most analysts and investors will look at.  Sales fell for the 3rd straight month down to a "seasonally adjusted" 5.02 million annual sales rate.  You can bet your gold that the number is statistically skewed to the high side.  Inventoies of existing homes for sale jumped by 10% 3.59 million, leading the normally uber-bullish NAR chief cheerleader to state:  "Yun said the January-to-February increase in inventory was much larger than usual in February. Inventories represented an 8.2-month supply at the current sales pace, the most since August."  (LINK).  Keep in mind that March/April is typically the peak listing period, so expect to see a lot more "for sale" signs in your area as homeowners either engage in "strategic default" (i.e. send their keys to the bank) and vacate or the ones who still have equity to preserve decide to sell.

Please bear in mind, that the inventory of existing homes would be substantially higher if banks were to release their foreclosed home inventory (REO - real estate owned) onto the market.  Furthermore, as per the self-imposed foreclosure moratorium by big banks during December and January, expect that the foreclosure rates will begin to spike - we're already seeing this to some extent in the numbers.  As banks let foreclosed homes pile up, expect the market will "feel" this "shadow" inventory and buyers will likely wait.  Also expect that most "frothing-at-the-mouth" buyers who jumped to take advantage of the massive taxpayer tax credit subsidy, which theoretically expires April 30, have already likely made their purchase.  Too bad for them because I expect prices to drop another 5-10% this year alone from where we are now.

Monday, March 26, 2012

Housing And Economy Starting To Crash Hard

 Just reviewed March buyer clicks, Google’s analytics on all the sites we monitor – March is turning out to be the weakest month since last October re: Buyer interest  -                                          email from a Realtor in New Jersey to Zerohedge
For many reasons explained in earlier posts, I have been thinking that - contrary to the what is being reported in the mainstream media - the small bounce we have seen in housing was nothing more than a product of the historically record low interest rates, an easing of credit availability and - probably most significant - the implementation of Government-sponsored FHA low down-payment, low rate programs.

If you strip away the seaonal adjustments and other data manipulation methods used by the Government, National Association of Homebuilders and National Association of Realtors, the truth is that real organic single family home buyers are not buying homes.  I define "organic" as the buyers who are not distressed investment buyers.  In fact, even during the period when mass foreclosures were halted until the robo-signing fraud was settled, investment buyers represented typically 30-40% of all home sales.

Today the NAR's pending home sales index was released.  It declined .5% vs. a market expectation of a 1% increase  LINK.   Please note that the pending sales index represents contracts, not closings.  I can't find the number on the NAR website for the latest month released, but in January the cancellation rate was 33%.  Only 47% of all contracts signed even closed on time:  LINK  So even when the headline number appears to be positive and well-spun, the underlying "organic" number is abysmal.   As of the February release, the 3-month moving average of investors as a percent of total buyers was nearly 49%: 
Investors are still rushing into the market, with distressed sales making up a near-record 48.7 percent of sales in February on a three month moving average, according to a new report today from Campbell/Inside Mortgage Finance  - CNBC's Diana Olick, sourced from Zerohedge.com LINK
In addition, now that the robo-signing fraud case has been settled on favorable terms for the offending banks by the Obama Administration, foreclosure activity is already starting to pick back up:   LINK  So we will see an increase in supply as banks begin to ramp up foreclosures again.  To make matters worse, Obama has directed Fannie Mae and Freddie Mac to unload big blocks of their owned real estate (REO) LINK.   Investors are lining up as I write this to bid en masse on FNM/FRE REO.  These homes will likely end up dramatically increasing the size of the single-home rental pool, thereby putting even more pressure on home values as potential buyers choose to rent instead of buy. 

And make no mistake about it, FNM/FRE are unloading their bloated housing inventory in order to make room for more foreclosures.  A friend of mine told me about a HUD conference last fall at which a friend of his was part of the catering crew.  Apparently the conference was being conducted more like a sales pep-rally to try and stimulate HUD sales and move inventory in order to make room for the next foreclosure wave by the GSEs.    Do you really want to believe the housing inventory numbers being released lately by the Census Bureau and the NAR?  I have maintained all along that the "shadow" inventory is easily double to triple what is being reported by the Government and industry associations.

The fact is that the housing market may have "stabilized" for a brief period of time, but it was a combination of the factors in the first paragraph above that enabled the short respite from the collapse caused by the big bubble blown by Greenspan and the subsequent attempted resuscitation of the bubble by Bernanke.  If you want to know why the housing market will not recover for at least a decade, if ever, take a look at this chart sourced from Zerohedge:

(click on chart to enlarge)

That chart is brutal.  It shows the ratio of people who are actually employed to the total population.  Not only does it show a massive decrease in the number of people working and generating revenue support for Government spending and welfare, but it shows a rapidly declining base of people who could even consider buying a home.  That picture is a snapshot of the true dismal condition of the U.S. economy.

For everyone who is wondering why gold and silver made a big move this morning, Bernanke gave a speech this morning in which he re-opened the door for more QE, after seemingly closing that door at his recent testimony to Congress on the state of the economy and monetary policy. 

But the fact remains that all you have to do read through this post in order to understand that the Fed has no choice but to print money if it wants to prevent a full-scale banking and economic collapse in this country; and, more important, provide the liquidity needed to finance new Treasury bond issuance.  Got gold?

Tuesday, July 27, 2010

House Price Bowel Movements - A Two-Part Opus (Supply/Demand)

I was chatting with a couple last night who is contemplating moving to Denver and was looking to buy an apartment. I suggested that they should rent rather than buy, because prices are going lower. They looked puzzled and asserted that they thought we were at a bottom. This motivated me to put together an analysis which should explain in no uncertain terms why housing has a lot farther to fall in price.

I think most people still buy into the argument that housing goes up in value over the long run and that price declines are to be bought. That fact of the matter is that if you look at housing prices since 1891, prices have gone up nominally around 3% per annum, or roughly in line with inflation. Net-net in real terms, housing has not increased in value (you can use google to source the data).

The current housing bubble and subsequent "pop" can be traced back to roughly 1991 and occurred in two-stages. The first stage of the housing bubble was fueled by the Fed taking interest rates from historic highs back in 1980 to historic lows still being plumbed today. When I started as a junk bond trader back in 1991, the yield on the 10-yr bond was around 8%. Today it is flirting with going below 4%. The Fed was able to engineer an increase in real estate by significantly lowering the cost of financing a home.

The second stage of the housing bubble, and the one which proved to be housing's demise, was the Fed and the Government in tandem proliferating the widespread expansion and use of credit. By 2005, there was so much fraud and abuse in the mortgage system, that there's actually accounts in which people were using their dog's name to get a mortgage and buy investment homes and criminals buying a portfolio of investment homes from prison cells (true stories). The Fed used this fraudulent increase in housing values to fuel all kinds of consumption-based economic expansion and the result was complete destabilization of the financial system, culminating with the de facto collapse of the banking system in September 2008.

So what now? The Fed is out of the gun powder it used to inflate the housing market from 1991 - 2007. Short term interest rates are essentially negative (on an inflation-adjusted basis) so rates can not go any lower, mortgage rates hit new record lows almost on a daily basis and still fail to stimulate new buying, and the reckless, fraudulent use of credit has been severely curtailed, though not eliminated entirely. If you take away these two factors, what dynamic can possibly keep housing prices from falling futher? 

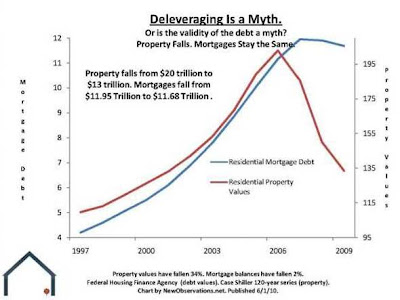
The myth out there is that the consumer is deleveraging.  Does this look like that's a fact?:

(click on chart to enlarge)

The fact of the matter is that the only segment of our system that has somewhat deleveraged (off-balance-sheet derivatives notwithstanding) is the financial sector.  But that debt was transferred to the public sector via Tim Geithner Treasury guarantees and outright Treasury monetization (thanks Tim, Barak!). If you add that into the blue line above, the consumers debt burden has actually increased.  Those are irrefutable facts.  I don't care what kind of garbage CNBC or the Wall Street Journal or Barron's or Obama want to propagate.  They are lying.

Once you remove the two extremely artificial, unsustainable stimulative tools of lower interest rates and unlimited credit, the two real economic components which drive price are supply and demand. Let's examine those.

Demand. Now that the taxpayer subsidy of home buying as expired, the demand for housing has literally dropped off of a cliff. Contracts on new homes hit an all-time low in May and hit an all-time low for June as reported yesterday (this data goes back to 1963, so you can see how extreme these numbers are). Existing home sales are also hitting record lows. What can possibly stimulate demand? The job market continues to contract, unless you include the public workers who are standing around watching other workers dig up our roads, clog traffic and build sidewalks to nowhere. But they already likely own homes or do not have the credit scores rquired to finance a home. So I don't see rising income and employment as a contributing factor. Anyone else have any ideas?

Supply. Although I don't know why, new homebuilders continue to build new homes. Of course, the last thing this market needs is a new sources of supply. The existing home base is in the process of being puked back onto the market in the form of "strategic" defaults - otherwise known as "jingle mail" - in which the underwater homeowner turns his keys into the bank; rapidly rising levels of bank and GSE-repossessed homes (REO inventory); rapidly rising levels of delinquent and in-default homeowners; growing numbers of "shadow" sellers who would like to sell their home but see the equivalent home across the street on the market for a lower price than the would-be seller is hoping to get.

Here's some proof:

14% Of Mortgages In Foreclosure OR Delinquent
Strategic Defaults Rising
Jumbo Mortgage Delinquencies 50% Higher Than Average
S&P Expects 70% Re-default Rate On Modified Mortgages
Foreclosure Supply Grows Pushing Prices Lower

More On Supply.  Here's a chart that I find really interesting.  The source is cited on the chart:

(click on chart to enlarge)

What these two graphs show is that 1) it is taking longer every month for banks to unload their foreclosed housing inventory - and we know this inventory is growing by the month and 2) there's a growing inventory of homes that are sitting delinquent for more than 2 years.  You want to live rent free?  Go buy a home and then default on the mortgage.  According to chart on the right, you might be able to go at least 24 months without making a payment before the bank kicks you out. 

And here's the most horrifying chart of all.  Anyone who looks at this chart, understands it and still buys a home either doesn't care about money or is insane:

(click on chart to enlarge)
Let me explain this chart.  This chart shows the number of existing homes reported to be on the market for sale PLUS the number of homes that have delinquent mortgages. The literal interpretation of this chart is that if every deliquent mortgage defaults and goes into foreclosure, the total potential housing inventory is close to 12 million homes.  The average monthly sales annualized of existing homes going back to 1999 is 479,000.  In the worst case, assuming all of the delinquent mortgages default, the existing home inventory is over 25 months.  Typical inventory historically is 5 months.  You can play "what if" with 7.7 million delinquent mortgages to skew the result,  but that works both ways.  If only 50% of the delinquencies foreclose, that number months inventory goes down to 16 months.  Still 300% higher than normal.  BUT, banks are known to be dragging their feet in declaring homes to be delinquent or in default (in order to avoid more capital reserve requirments), which obviously implies the 7.7 million number is likely too low.  Any way you want "manipulate" the numbers, the end result is that there is a supply avalanche of existing homes on the market and soon to be on the market.

So there we have it.  Demand for homes is rapidly declining and the supply is rapidly increasing.  Now, I know that Alan Greenspan and Ben Bernanke and Larry Summers believe that they have the magic formula for changing the universal law of supply and demand (what Ivy League douche-bag doesn't think of themselves as being above the laws of nature?).  But that realistically not being the case, there is only one way for the market to resolve the supply/demand problem as described above and that's with substantially lower prices.  Sorry but those are the facts of life and the underlying natural laws of the universe.

John Templeton, considered one of the founding fathers of the the mutual fund industry and one of the most respected investors in our era, said back in the early part of the decade from his retirement home in the Bahamas that he would not consider investing in U.S. real estate in any capacity until the price level had dropped 90% from peak valuations.  At the time that was more extreme than my view that prices would fall at least 75% from top to bottom. But looking at the facts, I would not bet against Sir John's proclamation.  I don't know if the ultimate price decline will be 75% or 90%, but I do know for certain that as long as there are people out there like the ones I was with last night who believe that prices have bottomed, the housing market still has a long way to fall before the ultimate bottom is reached.

Friday, December 3, 2010

Some Random Musings/Thoughts Late Thursday Night...

I have been busy during the day trading the crap out of the intra-day market volatility for both my fund and my own account.  As such, I've been a bit too preoccupied to post during the day.  In addition, as I was discussing with a friend tonight, I'm a bit burned out from spending the last three years researching/reading/analyzing etc in order to set up the fund I co-manage to be positioned to take advantage of what I believe will unfold financially/economically/politically in this country. I think we are entering the early stages of what will be a monster run in the metals/miners.  This is great for anyone positioned for what is happening - but really bad news for the well-being of the hoi polloi.

Of particular note, it looks like sophisticated institutional money is rushing into the large-cap, liquid mining stocks like SLW and AEM.  More significantly, real money is starting to sniff at the better quality, more visible junior mining stocks.  Some of the holdings in our fund have more than doubled over the last 2 months.  As such, this is still the early stage of what could be a breath-taking move in this segment of the mining stock universe.  As an example, ECU has moved from the high .50's to a recent intra-day high of $1.41.  It has pulled back and is consolidating this move.  I think it is now "coiling" for an even bigger move.  The last time around, starting in mid-2005 when I bought into the name personally at .34, it ran from my entry point to a little over $3.30 before the whole sector was manipulated into a crash by Bernanke/Paulson. I'm not saying that magnitude of a move will occur this time around - but it sure as hell could.

Let's work out some conceptual math using rough numbers to demontrate the possibilities using ECU.  Back in 2005, ECU had around 40 million ounces of 43-101 silver.  As my colleague Andy pointed out today in an email to our group, right now the juniors are being cap'd by the market at $1-1.25 per silver equivalent ounce.  In early '07 at the last valuation peak for juniors, the average valuation was anywhere from $4-7 per silver equivalent ounce.  Currently, ECU's share base has doubled since early '07 but its 43-101 silver has increased more than 10-fold to over 400 million ounces.  I'll let anyone interested in calculating possible price targets using ECU's current share base, 43-101 silver ounces and potential market cap targets.  In other words, stocks like ECU have quite a move ahead if we get a run like the market had the last time around.  And remember, back then the small cap mining stocks were largely fueled by the individual investor.  Contrast that with now, when it looks like bigger, more sophisticated capital pools are starting to discover the junior segment of the mining share sector...

George Orwell is smiling

If you just read the headlines, you would be led to believe that the U.S. economy is well on the road to recovery.  Black Friday weekend sales showed ebullient gains over last year, housing bounced a bit in October and the employment picture is improving. 

Of course, as Shakespeare penned thru "Macbeth," "nothing is but what is not."  What is "not" is any real data to support the fantasy being painted by Wall Street and its well-oiled media machine. It is my view, based on consumer polling and my analysis of the sales trends last weekend that, at this point, it would appear that very aggressive price discounting and marketing by the retail industry has "pulled forward" a substantial amount of holiday sales into the Black Friday weekend. 

As an example of media manipulation with the housing data, let's look at Toll Brothers.  The headline earnings release for TOL, one of the largest homebuilders, reported an unexpectedly big jump in earnings for the latest quarter.  Of course, if you look behind the proverbial curtain, you will discover that this gain was "manufactured" using a one-time tax benefit and some generous assumptions about the value of Toll's inventory - on and off-balance sheet. 

The fact of the matter is that new home sales continue to plummet and, overall, housing prices and true market real estate valuations continue to tank.  Furthermore, despite today's glossy headline announcing a record gain in the pending sales index for October, the bounce was generated from September's unexpectedly low index level and the index itself is still trending substantially lower vs. last year.  In addition, the actual and "shadow" inventory of homes for sale is spiking significantly higher.  As I dig through the "footnotes" that get completely ignored by the media, I can't help but conclude that a lot more pain is ahead for the housing market. 

The employment data is similarly chimerical.  If you just go by recent Government-generated employment reports and jobless claim data, you would think that the job market is gaining strength.  But I think by now everyone who cares enough to dig for the truth knows that the real unemployment rate is substantially higher than is being reported by headlines.   By "real" I mean the "real" workforce number, which would include not just the Government defined "labor market" - those employed plus those actively looking for employment - but would also include the rather large pool of workers who have given up looking but would still love to find a job.  The most conservative estimate of this can actually be found buried in the BLS employment report, which shows a "real" unemployment rate of 17%.  Private services like John Williams' Shadow Statistics estimate the "real" real unemployment rate is now over 20%. Lets also not overlook the Government's magical "seasonal adjustments" and other feats of data massaging.  In other words, welcome to the "Animal Farm" and the Ministry of Truth...

I'll conclude by linking  Alisdair Macleod's latest brilliantly and methodical calculations for where the price of gold is headed. This is a brief and concise must-read:  Gold is headed MUCH higher.

And I'm too fatigued right now to elaborate on the rapidly escalating fiscal catastrophies at all levels of Government (local, State, federal).  Not to mention the impending 2 million+ who will fall off the jobless benefit entitlements if Congress does not implement another emergency extension by the end of December. Suffice it for me to say with complete confidence that the golden truth of the matter is that the economy continues its death spiral into a massive depression and the price of gold and silver are set up to move up to price levels that will stagger the minds of all but the most informed of the precious metals community. 

Monday, September 24, 2012

The Truth About The Housing Market

Many of us who have to follow the news closely every day as part of our jobs woke up this morning to headlines of Lennar, the big homebuilder, reporting supposedly robust earnings for the 3rd quarter.  The stock was up over 2% in pre-market trading and the bubblevision news stations were doing cartwheels.  But LEN stock closed down 1.5% from Friday's close and the Dow Jones Homebuilder Index closed down 1.14% from Friday's close.  What happened?

If you peruse LEN's detailed earnings release, some interesting data stand out.  The headline shouts out that LEN's deliveries were up 28% from Q3 2011.  But actual increase in units was 785 homes.  That's 43 homes per State in which Lennar operates.  43 homes per State.  The total number of homes delivered in Q3 was 3,617.  Year to date for 9 months the total is 9,353 homes.  Assume a constant run-rate for Q4 and the total deliveries will be 12,400 for all of 2012 (truth is, Q4 will likely be a lot lower than the run-rate due to seasonality).  That 12,400 compares to 49,568 homes delivered in Lennar's 2006 peak selling year.  That's a 75% decline.  If you put the 49,568 vs 12, 400 in market context, think about what that means in terms of just how overbuilt and saturated the housing market is in reality, beneath the heavy sales-spin being applied by the industry about "recovery."

As for Lennar's reported earinings, again it's well worth looking beneath the ebullient headlines to see what's really going on - and I just happened to do that.  Lennar reported net income of $87.1 million vs $20.7 million in Q3 2011.   However, $25.3 million of that net income came from its mortgage underwriting operations (vs. $8 million in 2011).   Since the average price of a Lennar home is about $250k, we can assume most, if not all, of its mortgages get flipped into FHA, FNM and FRE programs - i.e. get sold to the Government/taxpayer.  I mentioned in a post earlier this month that the liberalized FHA underwriting standards and QE programs would transfer wealth from the Taxpayer to mortgage underwriters/brokers.  Well, there you have it first-hand in Lennar's earnings report.

Furthermore, Lennar's $87 million in reported net income, $12.8 million was derived from a non-cash tax accounting maneuver.  You can read the earnings report for details if you are curious.  But, quite frankly, it's basically the same kind of non-cash GAAP manipulation being used by banks who are reversing out loan loss reserves in order to pad reported income, as opposed to actually getting a cash earnings benefit.  The accounting maneuver serves no purpose other than to pad its bottom line for this quarter, in an attempt to make the stock price look appealing to brokers and investors who do not do their homework. Here's a link to LEN's earnings release today:  LEN

The reason I wanted to spend time shredding Lennar's earnings report was because in the last few months unjustified bullishness for the housing market has invaded the mainstream media and certain widely read blogs, Calculated Risk being one of them.  For some reason Wall Street, the media and Calculated Risk are looking at recent month-to-month data points and projecting a big housing recovery.   The fact of the matter is that most of data is based on accounting and data manipulation schemes, like "seasonal adjustments" and the use of reporting percentage changes rather than actual unit data.

In terms of industry fundamentals - truthful industry fundamentals - it's the same old story.  Yes, there's been a bit of a bounce in the housing market.  We would expect that to happen given that the Fed has successfully engineered record low mortgage rates, there's been unprecedented stimulus injected into the system over the past 3 1/2 years and taxpayer-sponsored FHA has stepped up its rate of subprime financing.

But if you look behind the media and industry spin on the numbers, a different story than what is being promoted emerges.  I've detailed the "shadow inventory" aspect to the housing market inventory several times on this blog.  In terms of unit sales and price increases being reported, I will refer you to a series of three blog posts by Mark Hanson - here are some excerpts:

1) On reported price gains:   When…

1) rates drop by 30% YoY allowing the 70% of buyers who use a mortgage to ‘pay’ 15% more for a house on the same monthly payment;

2)  foreclosures as a percentage of total sales drop 25% YoY lifting the “median” sale price:

3)  and you comp YoY against a stimulus hangover year;

…”prices paid” will ‘rise’ and ‘comps’ will look great.   But the benefits of stimulus and easy comps will soon turn into headwinds and difficult comps, which is exactly what happened in 2011 following the year+ long home buyer tax credit stimulus pump of 2009/10.  LINK and LINK
And on the pending home sale data released by the National Association Realtors:
Pending Home Sales number got everybody hot and bothered because the headline had the word ”higher” in it.  But what everybody fails to understand is that this year over 30% of Pendings fail to close. Last year less than 10% failed.  In fact, contract failures got so bad into Q2 that NAR quit releasing the data.
Here's the LINK

I hope everyone has a chance to read those quick pieces by Hanson - they are quite revealing and contain actual data analysis, rather than the hope-laced garbage thrown at everyone by Wall Street, the media and highly promotional industry associations.

Finally, here's some more cold water thrown on the housing party by Gary Shilling:  LINK  He sees another 20% downside in the housing market.  I think even that projection is optimistic.  I've said since 2003 that I expect to see a 50-75% decline in housing from the top to the bottom.  I am more inclined to bet on the 75% number and I'm beginning to think - short of the Fed printing up money to buy up a few million homes and bulldozing them - that we could see a top to bottom decline greater than 75%.   As I've pointed out before, Sir John Templeton (of Templeton mutual fund fame and one of the "fathers" of mutual fund investing) said in 2002 and before his death that he wouldn't touch U.S. real estate until dropped 90%...

Tuesday, August 24, 2010

The Existing Home Sales Data Bomb

As everyone knows by now, existing home sales for July plunged a record 27% from July and were 25% below July 2009.  This was a record sales drop, as sales of single-family homes fell to a 15-year low.  The Einsteins on Wall Street were expecting a 13% decline, demonstrating once again the uselessness of Wall Street research. Here's the news link:  NAR press release

The National Association of Realtors and CNBC and other mass media of course are finding a silver lining in the fact that the median price was up .7% (that's "point seven percent") from 2009 to 2010.  I would suggest that the home-buyer tax credit was responsible for temporarily stabilizing prices and that the data massaging, otherwise known as "seasonal adjustments," likely produced arithmetic which gives the illusion of slightly higher prices.  At the end of the day because of all of the data manipulation it can argued that a .7% change in the data from July 2009 to July 2010 is not statistically significant/meaningful.  Moreover, the measured inventory (vs. the shadow inventory we all know is out there) increased, suggesting that supply and the lack of tax incentives will negatively influence prices going forward.

Ironically, July is supposed to be one of the peak selling months for homes.  If that's the case, the housing market for the rest of 2010 is doomed.  The Government and the Federal Reserve market interventions have served no purpose other than to keep a market artificially and temporarily propped up, which will ultimately lead to further damage going forward.  The country can not afford to continue tax-subsidizing home buyers at the expense of everyone else and the Fed is largely out of interest rate bullets.  Essentially, all the Government tax subsidy did was keep housing prices artificially high, thereby transferring a massive amount of wealth to the sellers, real estate brokers and mortgage banks at the expense of the moronic buyers and the rest of us.

At some point the bond market will start regressing back up to some mean level of interest rates - i.e. interest rates will head higher - and then we will see a serious wipeout in housing values.  I am not going to put a timeframe on when this will occur, I just know that it will occur and it will start happening when it is least expected.  Of course, judging by the record amount of investor cash flowing into bond funds - see this Bloomberg article:  The bond bubble - it appears as if investors are currently least expecting the bond market to tank. Perhaps the current timeline of the bond market may be analogous to that of the internet stock bubble in 1999.  And we all know what happened in the spring of 2000...

Thursday, September 13, 2012

FOMC: This Is The Beginning Of "The Big Print" - Unlimited QE

The fact that enough people still listen to Cramer is the perfect indicator of just how stupid part of our population is and it explains how we - the people - let our country lapse into systemic collapse.  At it's base level, Government intervention in our lives prevents the Darwinian mechanism of natural selection from doing what it's supposed to do.  That Cramer still sells his crap and that CNBC is still on the air is a perfect testament to that...Dave in Denver
For the first time since QE first started, today's FOMC announcement stunned me.  Not because I was expecting something other than what was announced, but because of what was actually announced and the timing of the announcement.  I have been expecting eventual global QE to infinity since like 2003.  Seriously.  I didn't think we would get the first indication that it's coming today, two and a half months ahead of a Presidential election, and I didn't think it would come first in the form of a direct attempt to reflate the housing market with subprime mortgage paper.

Let me explain.  Here's the only important part of today's announcement (the low-rate extension to mid-2015 was highly telegraphed and is about as useless as the new iPhone 5 on Mars):
The New York Fed said it will start buying agency mortgage-backed securities on Friday, at a rate that is expected to total $23 billion over the remainder of September. It will then purchase securities at a clip of $40 billion each month. The New York Fed said it will concentrate its purchases in newly-issued agency MBS in the to-be-announced market, although it may purchase other agency MBS if market conditions warrant (LINK)
Furthermore, the Fed said it will add to its purchases if the labor market doesn't improve, it will keep its policy stimulative for a "considerable time,"  and it left the duration of the mortgage purchase program open-ended.  De facto QE to infinity.

The question is why?  The Fed is specifically targeting the monetization of new mortgage issuance by the GSE's.  But we've been told up and down Wall Street and from the industry promoters - Nat'l Association of Realtors and Nat'l Association of Home Builders - that the housing market is bottomed and moving higher. I have heard countless TV economists get on CNBC/Bloomberg/Fox Biz and tell us that now is a great time to buy a home (see the cover of last Friday's "Barron's").

So why target housing specifically?  We lose manufacturing jobs in this country every single month.  Why not target that?  The two biggest problems with housing are 1) the massive shadow inventory, as detailed on this blog; and 2) the rapid decline in the average weekly income of the middle class, which means there are less people who can afford to buy a home or stay in the one they own.   A mortgage purchase program will not address either issue. 

What makes this specific QE program frightening is that to the extent that there is growth in housing mortgage finance, it's coming from the FHA.  The FHA, as I've detailed on this blog recently, is a  subprime lender disguised as a GSE.  It requires only 3.5% down to purchase and someone who refinances can take down a mortgage that exceeds the value of their home and receives mortgage payment insurance at a rate that is heavily subsidized by the Taxpayer.

What the FOMC policy decision, and the timing of the decision, tells me is that the overall economy is in big trouble and the Fed is going to try and stimulate economic growth by reflating the housing bubble using sub-prime paper.  That fact that the program is entirely open-ended, with no defined goals or parameters, tells me that we are on the insidious path to complete fiat currency devaluation via unlimited QE, because if this policy does not do anything, which it won't (other than generate bigger commission checks for a few mortgage brokers) - the Fed will be forced to implement even more drastic policy measures.

And this is why gold and silver have reacted so sharply today.  The low on silver ahead of the policy announcement was $32.72 and $1720 on gold.  As I write, silver is at $34.72 and gold is at $1769.  This is an incredible reversal.  It also tells you the degree to which the market agrees with my assessment.  I want to conclude with a great quote from Austrian-School Economist, Murray Rothbard, which I hypothecated from my friend and colleague Jesse of Jesse's Cafe Americain: 
Gold was not selected arbitrarily by governments to be the monetary standard. Gold had developed for many centuries on the free market as the best money; as the commodity providing the most stable and desirable monetary medium...I see a great future for gold and silver coins as the currency people may increasingly turn to when paper currencies begin to disintegrate.

Wednesday, November 14, 2012

It's Getting Ugly

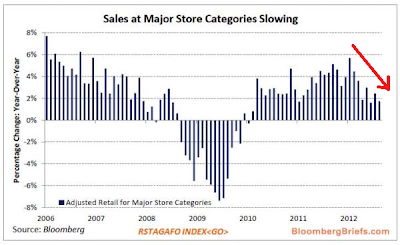
The declining state of the economy, as I've been explaining for a while now, is starting to finally manifest in economic and financial reports.  As most of you know, corporate earnings for the 3rd quarter have been pretty dismal, with lots of earnings "misses" occurring.

Second, the Government released its "income statement" for the month of October, the first month of the Govt's Fiscal Year 2013.  It showed a $120 billion deficit, substantially higher than was expected and estimated and higher than October 2012's $98.5 billion.  Here's the LINK  The Government is saying "technicalities" led to a higher deficit.  But the OMB didn't seem to know about those technicalities when it projected a $113 billion deficit a couple of weeks ago.  Where were these seasonal "technicalities" last year?  I smell an accelerating spending deficit coming, which means more printing!

Also, retail sales for October were reported this morning and, not only did the headline number "miss" expectations, but the monthly print was negative - a sequential decline from September.  The Obvious "explanation" for this is Hurricane Sandy.  But the Government statistical geniuses typically make adjustments to smooth irregularities like that out of the number AND one would have expected to see a pop in retails sales, as areas expecting to be affected would have experienced a "run" on groceries, hardware items and propane.  That excuse does not fit.  Nevertheless, below is a chart sourced from Zerohedge, with the data sourced from Bloomberg, which shows monthly retail sales:

(click on chart to enlarge)

Anyone notice anything interesting (the red arrow is my edit)?  Not only is the trend for retail sales declining pretty quickly, but it was also declining during the "all-important" back to school season, July - Sept.  I think this chart encapsulates the picture of the average American's finances and lack of disposable income.  The holiday season spending this year could be exceedingly ugly.  It will be interesting to see if the banks roll out some incredible revolving credit deals for the season.  If you do see that know that the Federal Reserve is behind that and, ultimately, the Treasury/Government.

Finally, I know I've been threatening to post a big report on the housing market, showing its impending demise.  I have been collecting data for this and it will take some time to write something meaningful.  Since I don't get paid to write this blog, I need to find the time - I'm hoping some time in the next week.  What I can say is that, based on looking at the data I've compiled already, the "under the hood" data for the housing market is startlingly weak.  I say "startlingly" because the Fed has driven mortgage rates to record lows, the banking industry in conjunction with the Government has prevented a lot of the "shadow inventory" from hitting the market and the Government has rolled out, thru FHA, a massive mortgage purchase and refinance program which is a "sub prime" quality lending program designed to try and really stimulate "organic"/primary residence purchases. All of those measures combined have barely stimulated a "bounce" in the numbers and the market is getting ready to do another big cliff-dive.  To be continued...

With respect the Government's spending and debt accumulation situation, I fully anticipate that some way, somehow, after a lot of political grandstanding and accounting chicanery, an agreement to kick the fiscal deficit can down the road will be reached.  We already know that the Democrats in the Senate, via Harry Reid's comment last week posted above on the right side of this blog, plan on asking for a $2.4 trillion bump in the Treasury debt limit ceiling.  That tells you right there we can expect a deficit of at least $2 trillion for FY 2013.  My personal view is that the politicians in DC do not have the mettle required to let the "fiscal cliff" event occur - neither does the President, nor would Romney have either for that matter.  As history has shown time and again, the Government will spend and print until the currency ultimately collapses...